
The MicroPK Database: Evaluating the Evidence
How statistical patterns point to bias—not psychokinesis.

After a failed three-lab replication, the question wasn’t how Micropsychokinesis (MicroPK) works—it was whether it exists at all. In response, IGPP launched a collaboration to compile and analyze a comprehensive database of MicroPK experiments.
Psychologists Holger Bösch and Fiona Steinkamp, with Emil Boller (who oversaw the FAMMI data), produced the Bösch–Steinkamp–Boller meta-analysis (BSB-MA, 2006). The inclusion rules were strict so heterogeneous studies could be compared fairly: psychokinesis tests only (not telepathy), true (not pseudo) RNGs, and outcomes convertible to binary hit/miss.
The final database comprised 380 MicroPK studies over 35 years from 62 principal investigators, plus 137 matched control studies. The dataset and coding files were made public. BSB used funnel plots on the MicroPK database to examine asymmetry and publication bias; they did not publish a control funnel plot—so I created and evaluated it for side-by-side comparison.
My contribution builds on that foundation. Prior assessments treated the scatter of data as random and uncorrelated; I derived confidence interval curves that account for internal correlation and directional bias, i.e. a preference in the binary data for outcomes to shift persistently in one direction, and applied them to these plots. This side-by-side analysis with adjusted confidence interval curves shows that the observed asymmetries track human biases, not a mind–matter effect.
Applying Confidence Interval Curves to the Funnel Plot
Funnel plots are standard tools for spotting publication bias and effect-size heterogeneity. In MicroPK, the funnel is not only asymmetric but also over-dispersed—a wider scatter than pure randomness predicts. BSB noted this excess variability with formal tests. I extended their approach by deriving confidence interval curves for correlated, biased binary sequences (capturing long-range dependence), then applying them to the MicroPK and control data.
Step 1: Start with the conventional confidence interval curves.
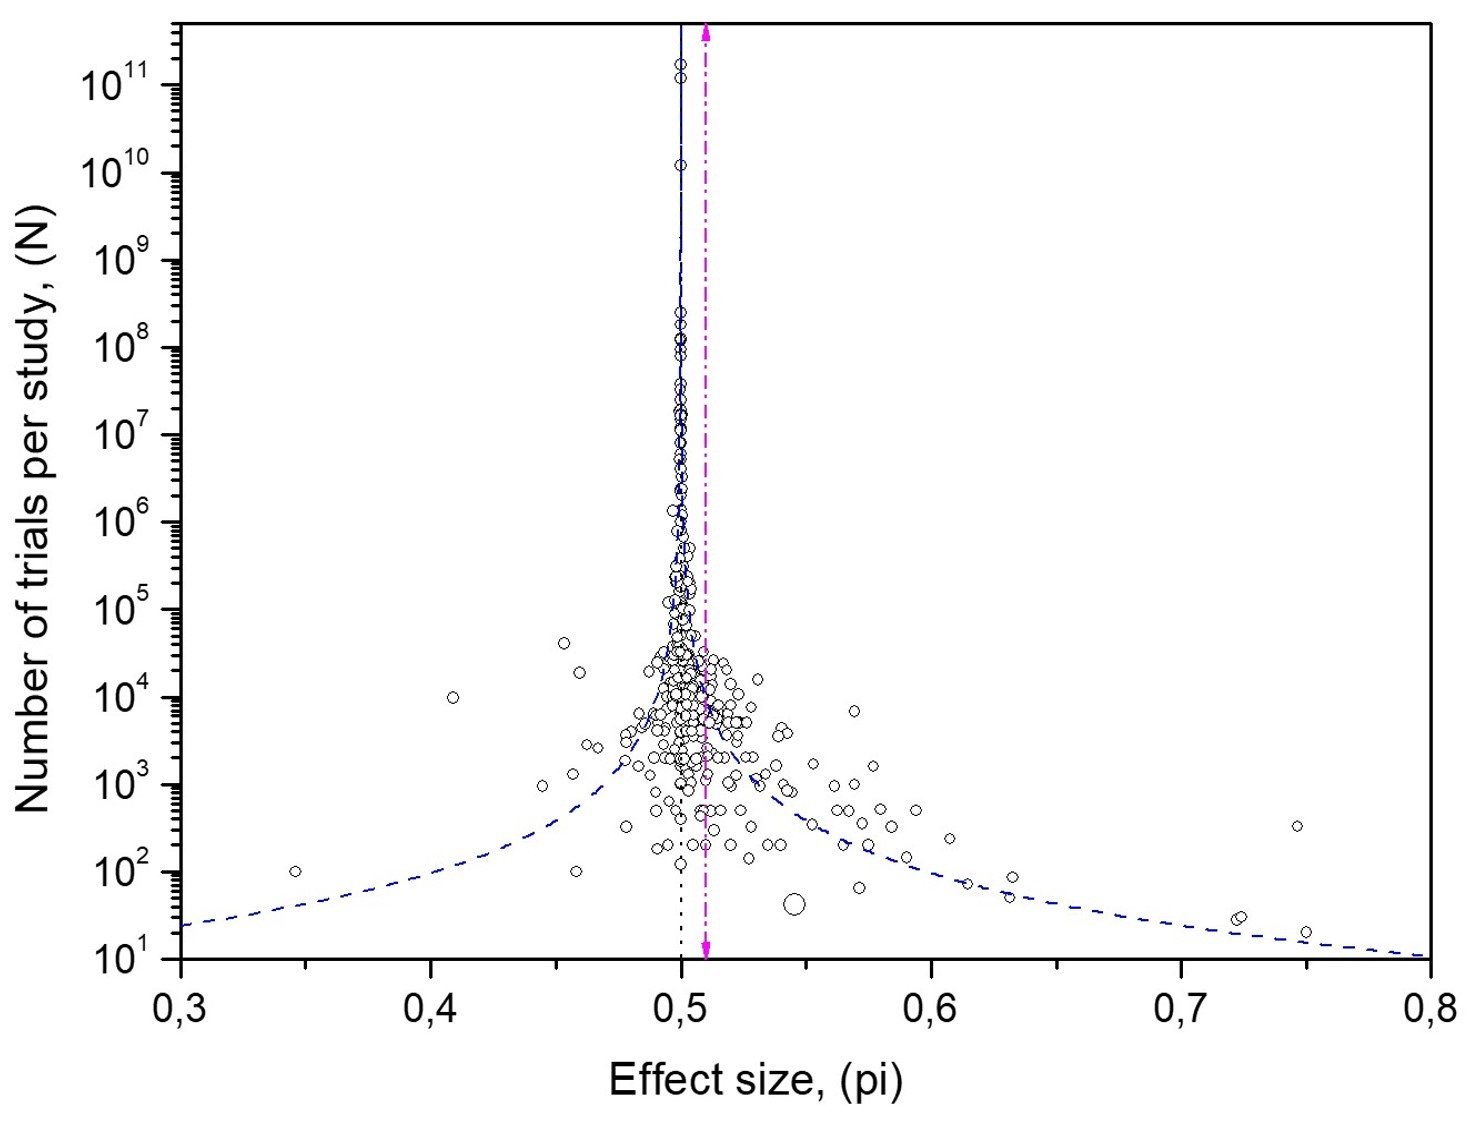
Overlaying 95% intervals for independent data on the MicroPK funnel shows well over 5% of studies outside the limits—evidence that independence is violated. This motivates model-based confidence interval curves that allow internal correlation.
Step 2: Add the control comparison.
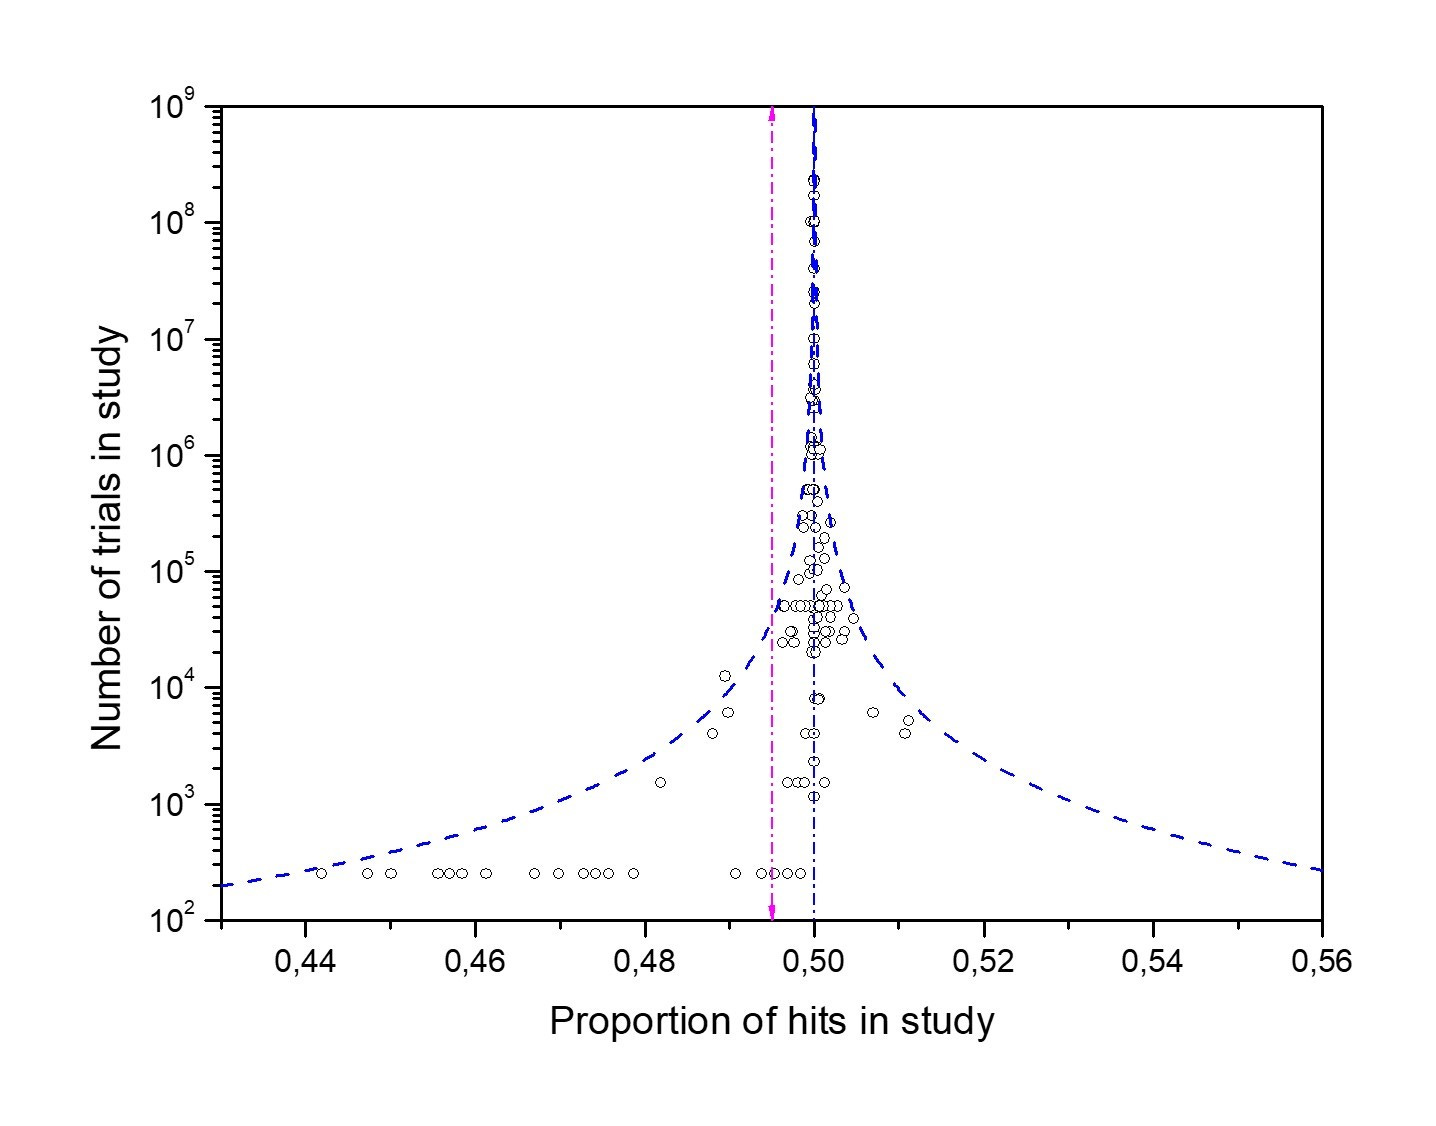
Applying the same analysis to the 137 control studies (Fig. 6) shows convergence to 50%, consistent with properly functioning RNGs. That the MicroPK funnel (Fig. 1) also converges to chance, despite its asymmetry and excess spread, argues against a consistent mind–matter effect.
About the “small-study only” argument.
After null replications, some suggested the effect appears only in small studies (by analogy with medicine). This is a post-hoc reformulation that multiplies assumptions and violates Occam’s Razor: a real mind–matter effect should not depend on how many studies are run in a test, especially since ‘large’ datasets are created simply by piling together many small-trial sessions.
What simulations clarify
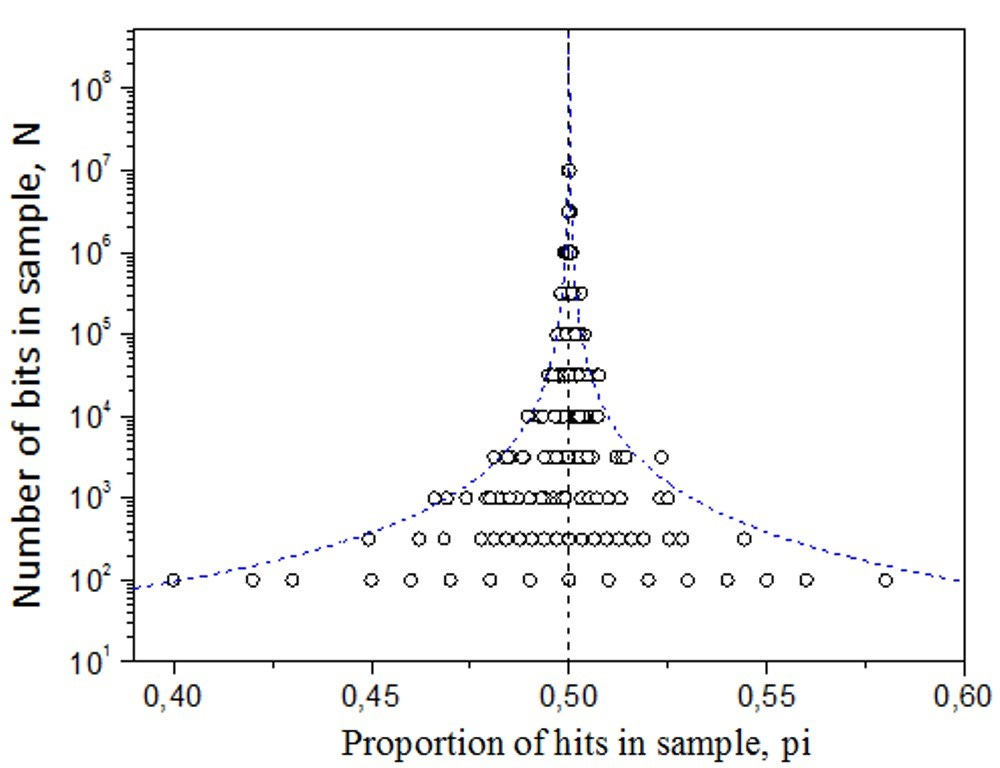
Using MATLAB, I simulated (a) random binary sequences and (b) biased Markov-like sequences with known self-transition probabilities (von Mises, 1964). In both, the scatter remains symmetric around the convergence point—even when biased—because data are not selectively removed. The real MicroPK funnel’s asymmetry plus over-dispersion therefore points to reporting/experimenter biases and internal correlation, not to psychokinesis.
What This Means
Conventional confidence interval curves underestimate the scatter; corrected ones fit it—but the shape (asymmetry) still betrays human processes, not a mind–matter signal.
Confidence Intervals for Correlated Binary Data: A Markov-Based View
To move beyond the assumption of randomly distributed, independent data, I derived confidence interval curves for binary sequences with memory, extending von Mises’ treatment of Markov-type processes (hit/miss outcomes in MicroPK).
What the model specifies.
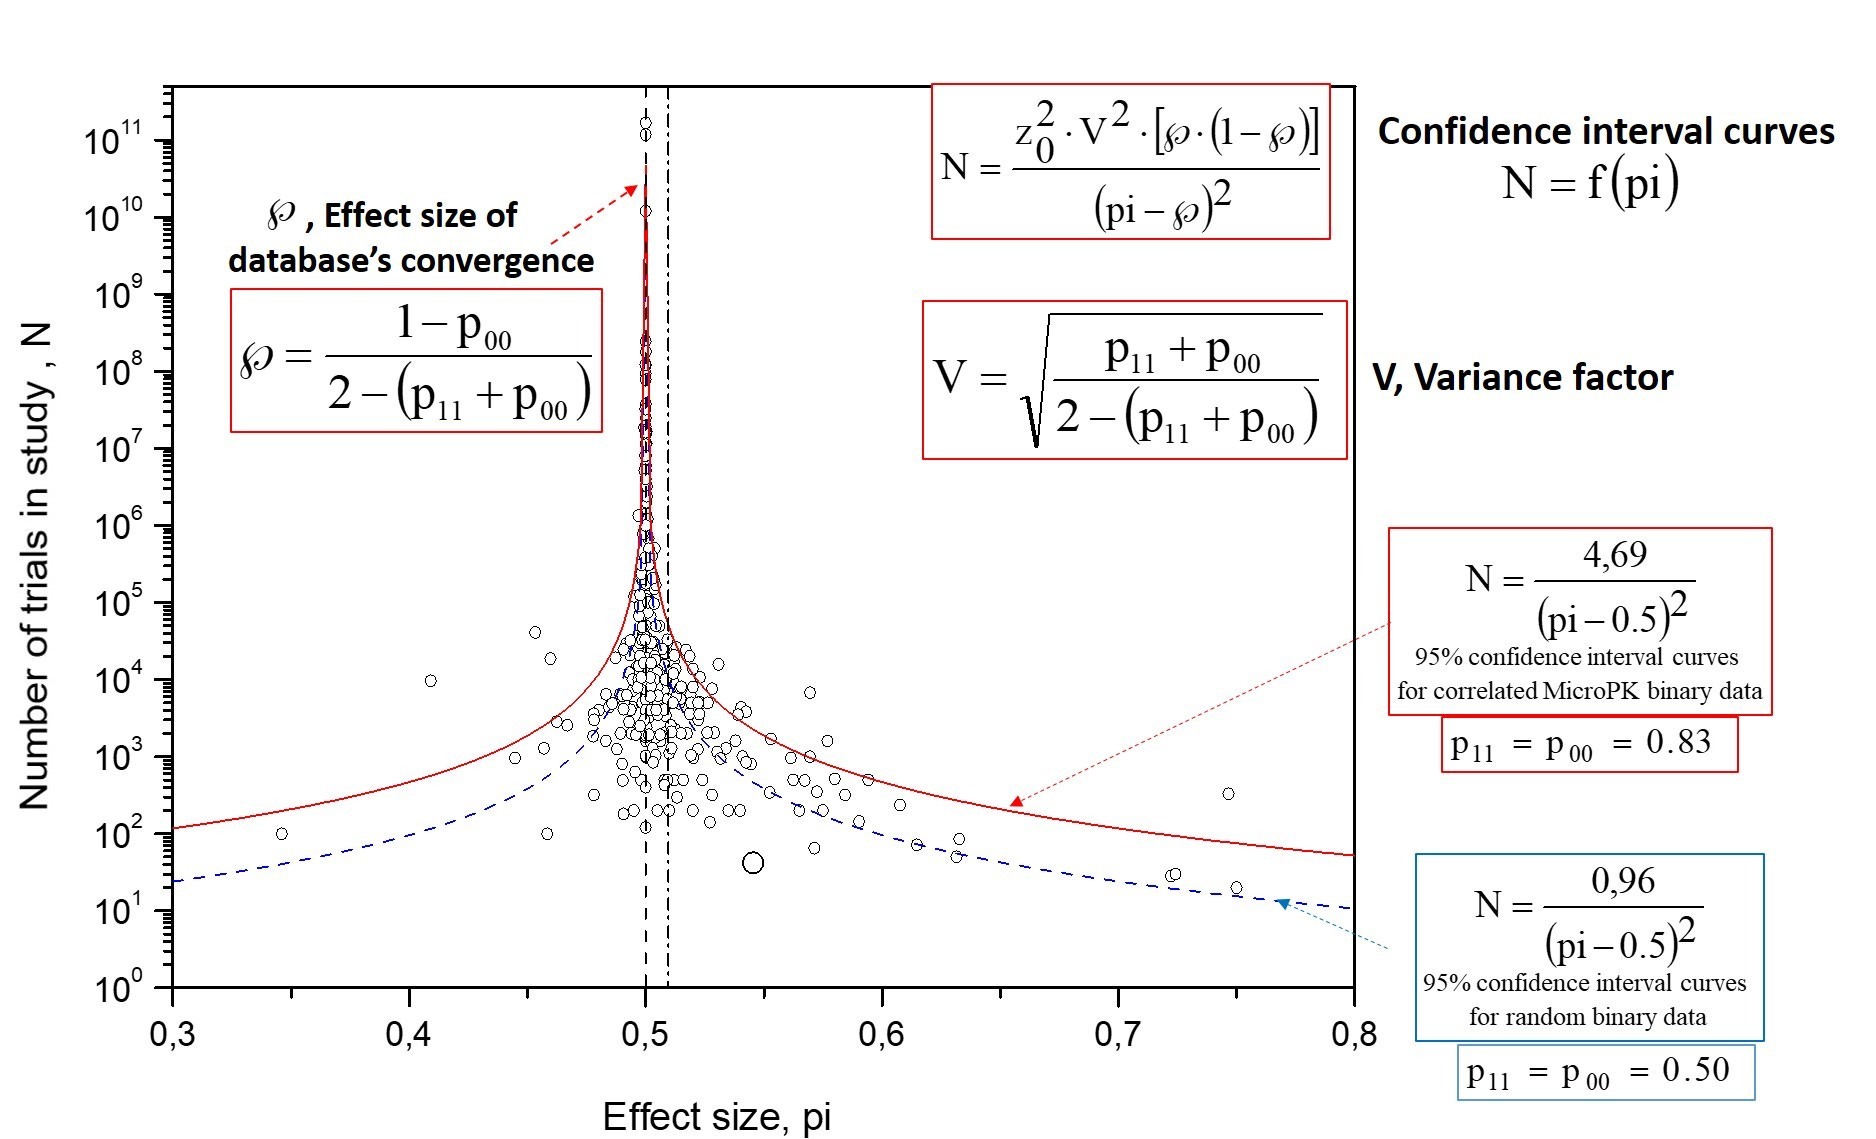
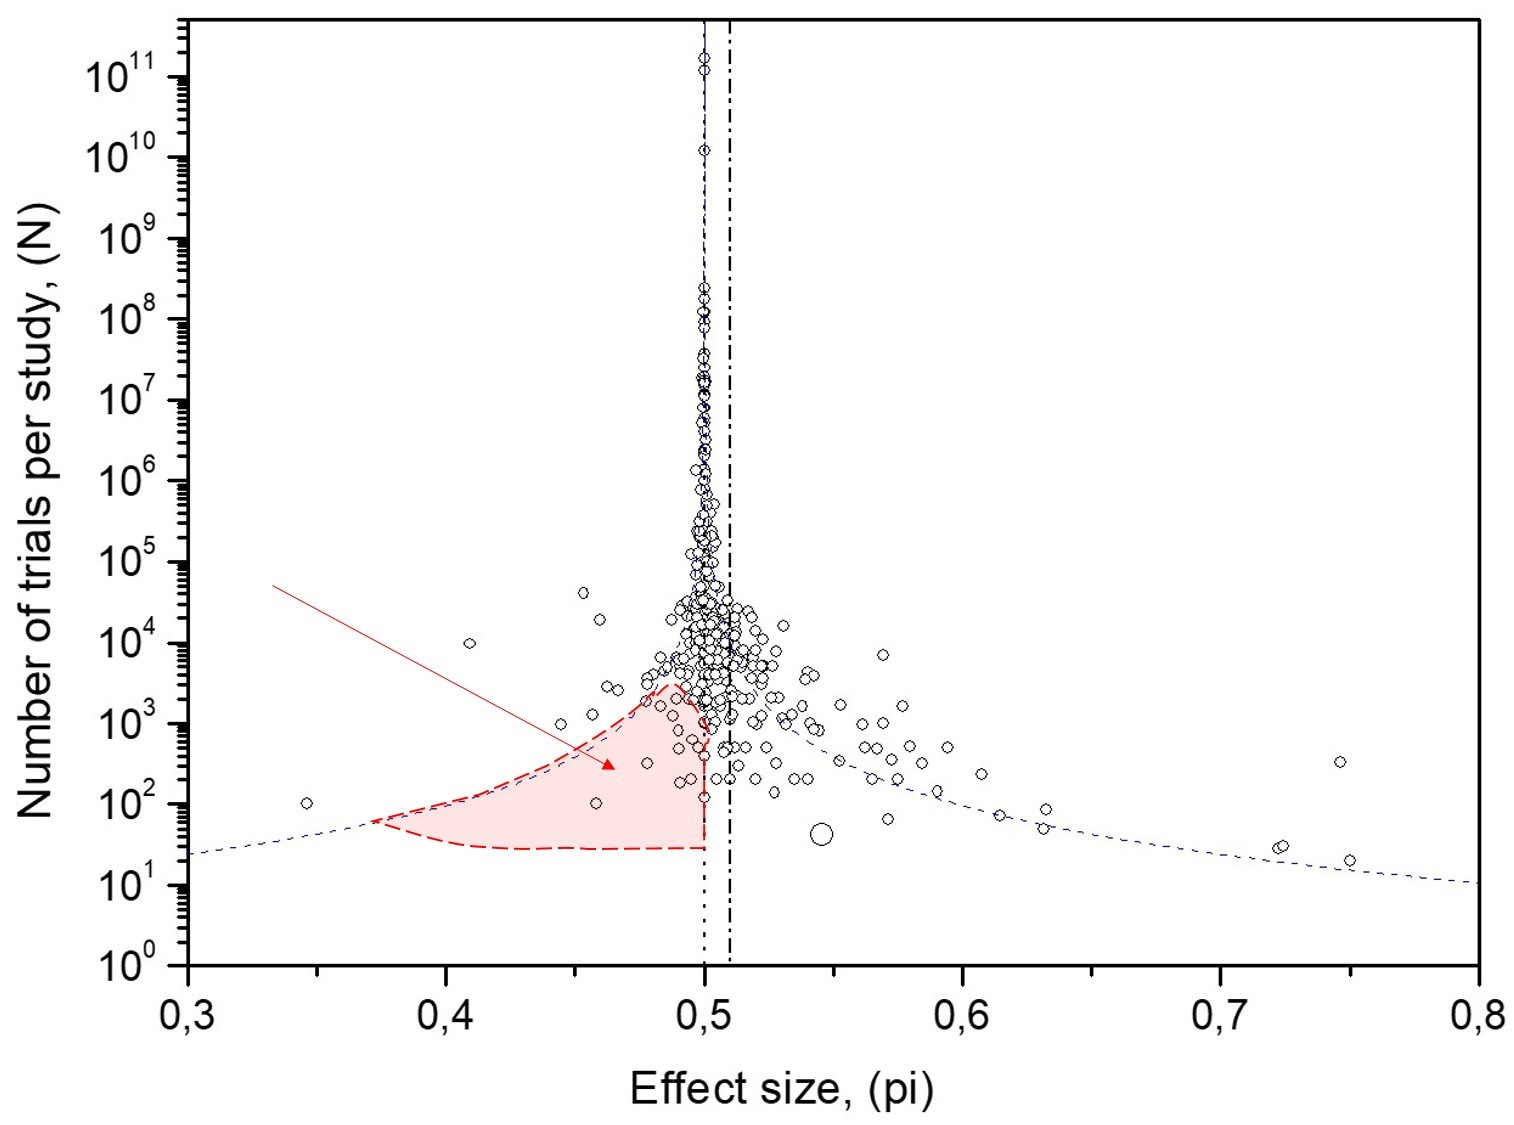
The equations (shown inside Fig. 4) define (Pallikari, 2019):
the convergence point ℘ of hits as a function of the self-transition probabilities p₁₁ (hit→hit) and p₀₀ (miss→miss), and
a variance factor V that controls the funnel’s spread.
For random data, V = 1. If V > 1, the funnel widens; if V < 1, it narrows. ℘ equals 50% when p₁₁ = p₀₀, exceeds 50% when p₁₁ > p₀₀, and falls below 50% when p₁₁ < p₀₀. As with standard interval curves, the 95% confidence interval use Z₀ = 1.96.
Why this matters for MicroPK.
These Markov-based confidence interval curves (red in Fig. 4) adapt to internal correlation and directional bias and accurately enclose the expected percentage of points—unlike conventional confidence interval curves (blue) that assume independence.
General utility.
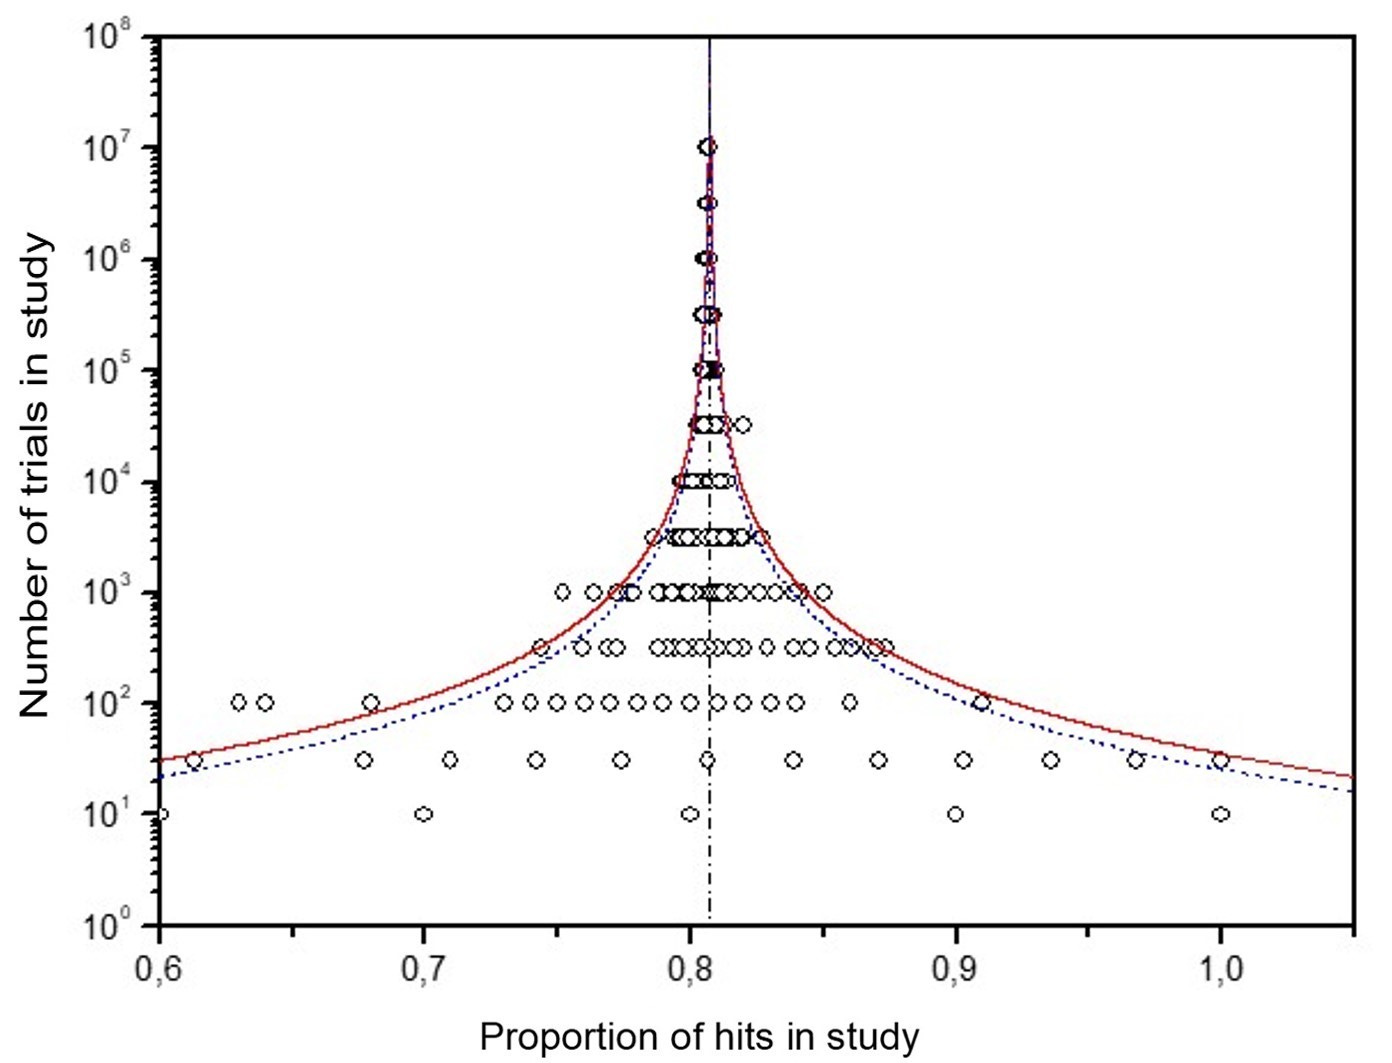
Because many meta-analytic datasets exhibit dependence, the same framework applies outside MicroPK (e.g., the chimpanzee handedness database, Fig. 5).
What the control funnel reveals
Applying the same method to the 137 control studies (no intention) is decisive (Fig. 6):
The distribution is asymmetric: lower-powered studies cluster below 0.5, a mirror image of the MicroPK skew. This is the signature of publication bias—results that don’t align with the expected direction tend to be missing from the record.
The database average deviates from 50% (statistical average π = 0.495, SE 0.001), while the expected convergence point remains ℘ = 0.5. The mismatch between π and ℘ is what publication bias looks like on a funnel.
The scatter is too tight: about seven studies should fall outside the 95% bounds, yet almost none do. This suggests experimenter-introduced error—adjustments or omissions to keep controls at 50%. Not fraud, just lax practice.
What This Means
Confidence intervals for correlated (biased) MicroPK data explain the extra spread without invoking a mind–matter signal; the shape—its asymmetry plus tight spread in control data —reveals publication bias and experimenter-introduced error embedded in the database.
Challenges in Communicating the Model
When I first submitted this work to a journal of psychical research, the paper was rejected with a final decision—no right to respond to reviewer comments. The reviews revealed two recurring misunderstandings.
1) Confusing trial codes with RNG bits.
The reviewer’s comment confuses protocol-level trial outcomes (hit = 1, miss = 0) with raw RNG bits. Their suggestion to remap alternations (01, 10) as ‘1’ and repetitions (00, 11) as ‘0’ is not an analysis but a post-hoc recoding of the data. Such remapping changes the structure of the outcome sequence itself and constitutes data manipulation. Moreover, their assumption that alternations should occur with frequency >50% is incorrect; in the meta-analytic sequence the combined frequency of (01) and (10) is ≈17%. The critique rests on a misunderstanding of both the coding and the statistics.
2) Interpreting serial dependence as “huge PK.”
One reviewer argued that the estimated self-transition probabilities p₀₀ = p₁₁ = 0.83 were a ‘fantastically large PK effect’ and even credited them to my R/S analysis. In fact, those values came from fitting confidence-interval curves to the funnel plot, not from R/S. And they do not show psychokinesis: equal high p₀₀ and p₁₁ keep the mean at 50% but inflate the variance. For context, p₀₀ = p₁₁ = 0.83 means a neighbor-to-neighbor correlation of ~0.66 in a MicroPK test—exactly the kind of structure expected from experimenter bias, not mind–matter effects.
Why the confusion matters.
The model’s core result—convergence toward 50% despite visible heterogeneity—contradicts a replicable MicroPK effect. Data correlation widens the funnel; it doesn’t create a shift from chance. Some reviewers inverted that logic, reading the fingerprint of bias and error as support for a stronger effect.
I have posted excerpts of the most relevant reviewer remarks with detailed replies on my website. The episode illustrates how unfamiliarity with confidence intervals for correlated (biased) data can obscure a simple conclusion: the patterns observed on the funnel plot are based on human biases, not mind-matter interaction.
Markov’s Letter Sequences and the Accuracy of My Model
The framework I use for the funnel plot convergence point (℘), variance factor (V), and confidence intervals in correlated binary sequences extends von Mises’ treatment of two-state Markov processes. A useful external check is Markov’s 1913 analysis of vowels/consonants in Eugene Onegin.
Markov estimated the self-transition probabilities:
p₁₁ (vowel→vowel) = 0.13
p₀₀ (consonant→consonant) = 0.33
For a two-state Markov chain, the steady-state for state “1” is:

Substituting the above values yields ℘ ≈ 0.435 (43.5% vowels; 56.5% consonants), in close agreement with Markov’s observed proportions (43% / 57% from 8,638 vowels and 11,362 consonants). This external match supports the correctness of the model used here.
The close match with Markov’s counts is an independent check that the ℘ and V formulas used here are correct.
Three Types of Bias in the MicroPK Database
The funnel plots display structured, non-random patterns—asymmetry and abnormal spread—arising from how studies were reported, misreported, and socially reinforced. These are systematic effects, not random variation.
Three biases are especially evident (Pallikari, 2023): publication bias, experimenter effect bias, and conformity bias.
1) Publication bias
In a database as large as the 380 MicroPK studies, chance alone should yield a balanced distribution around 50%. In Fig. 7, the left side (below-chance results) is underpopulated within the 95% confidence interval curves—where many studies should appear by chance. The dataset’s mean is ≈51%, while the funnel’s convergence point is 50%. This mismatch indicates selective underreporting of below-50% outcomes, creating an illusory positive shift. Simulations and confidence intervals for correlated (biased) data show that internal correlation can widen the funnel, but cannot by itself produce this left-side void (cf. the symmetric simulated funnels in Fig. 2).
2) Experimenter effect bias
The two funnels show complementary distortions:
• MicroPK (n = 380): Overrepresentation beyond the right-hand 95% confidence interval curves—consistent with errors that inflate effects above 50% in the expected direction.
• Controls (n = 137): Points are too tightly clustered within the 95% confidence interval curves, especially near 0.5. Roughly 5% (≈7) should fall outside by chance; outliers are scarce.
Together, this suggests experimenter-introduced error—well-intended adjustments or quiet exclusions that “keep controls near 50%” or nudge MicroPK results upward. Not an accusation of fraud; rather, lax protocols and expectations.
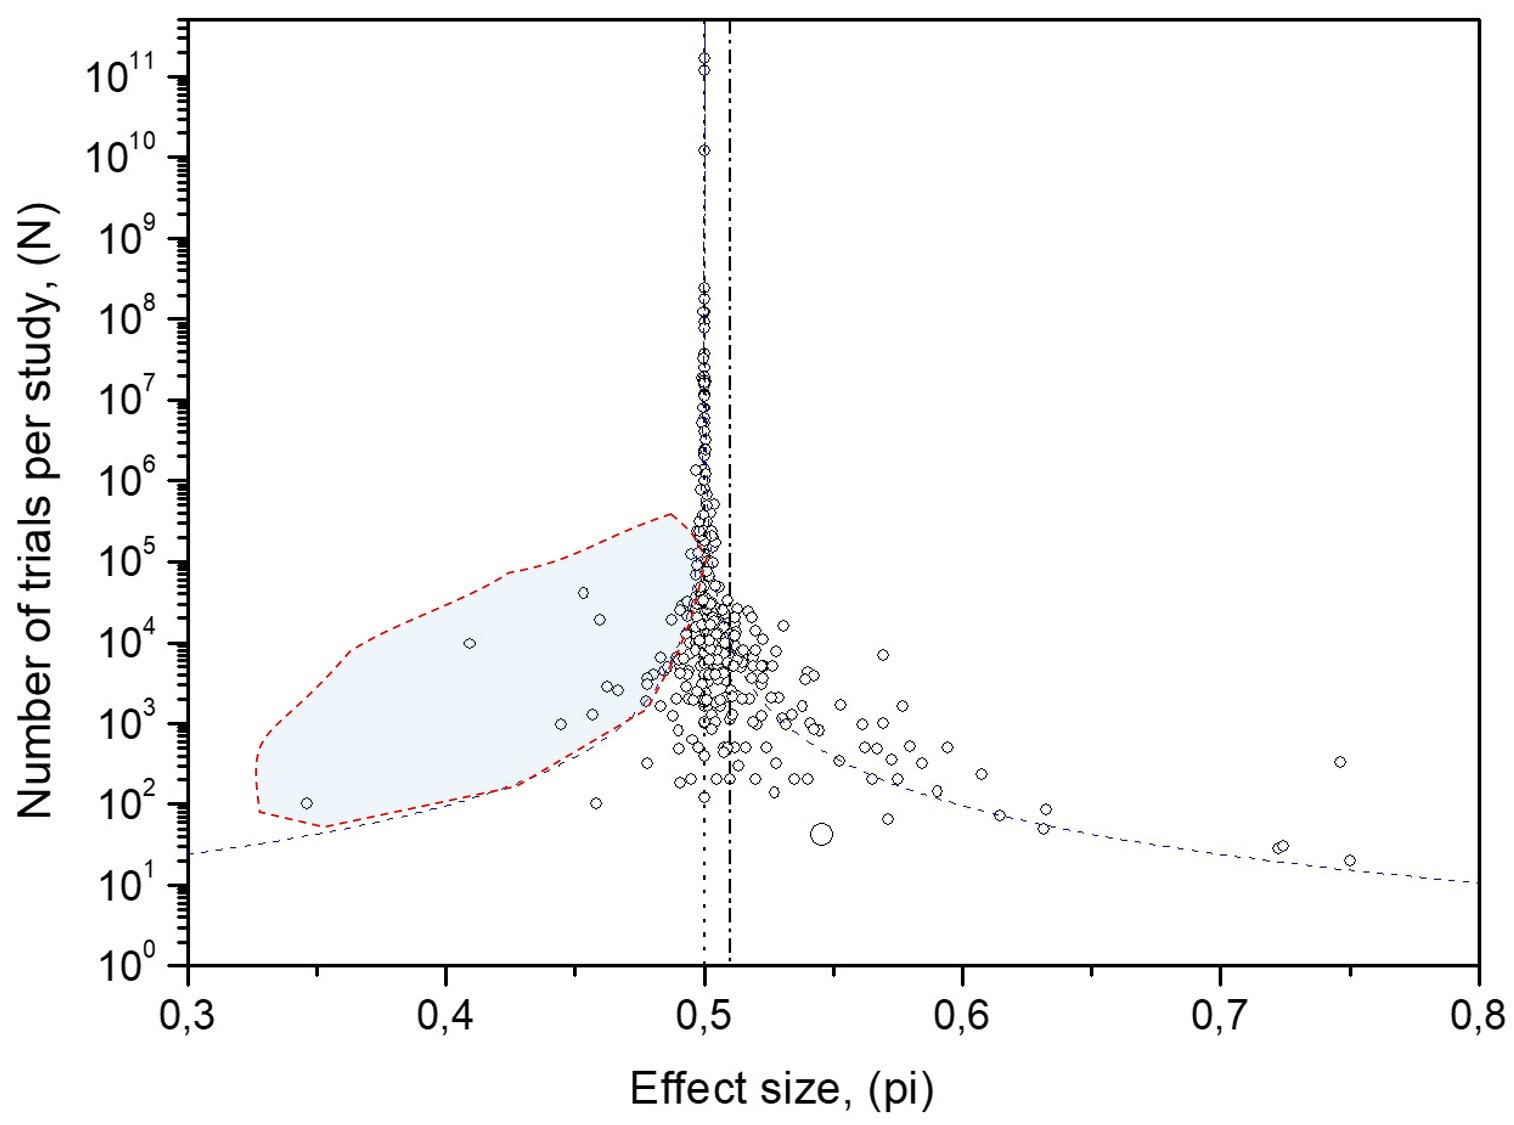
3) Conformity bias
Social dynamics amplify whichever result appeared most recently. In the MicroPK funnel this predominantly appears as overrepresentation on the left beyond the 95% confidence interval curves (Fig. 8)—more extreme below-chance studies than randomness would predict. Ordering studies chronologically and applying Rescaled Range (R/S) analysis yields H > 0.5 (persistence), whereas repeated shuffles of this time-series give H ≈ 0.5; the control series also shows persistence (Pallikari, 2019). This is the footprint of conformity bias: once a direction is set, later studies tend to align with it, often via unintentional, expectation-consistent errors.
An Occam’s Razor Reading of the BSB-MA
Occam’s Razor asks us to prefer the simplest account that explains all the evidence. For MicroPK, rescuing the hypothesis now requires a growing list of ad hoc conditions: that effects appear only in small studies, or only when experiments aren’t repeated too often, and—when needed—that the agent can even act against intention to explain the surplus of below-chance outcomes. Each extra condition complicates the theory without giving it any power to forecast future outcomes.
A simpler, evidence-based account fits the data: human factors. Publication bias, experimenter-introduced error, and conformity bias—amplified over decades—naturally produce the observed asymmetry and abnormal scatter without invoking unknown forces (Pallikari, 2023). Confidence interval curves for correlated (biased) data account for the excess spread. The funnel’s shape shows inflated tails in MicroPK (more pronounced on the right, weaker on the left) with a left-side void, while the control funnel displays the mirrored void and unnaturally tight clustering. This is what long-standing reporting practices and expectation effects look like. By parsimony, the bias model is the better fit.
Conclusion: No Evidence for Mind–Matter Interaction
The anomalies in the MicroPK database are not evidence of a physical influence of mind on matter. They are statistical fingerprints of publication bias, experimenter-effect bias, and conformity bias—confirmed by both MicroPK and control data, which ultimately converge to 50%. Sequence tests show persistence only when studies are ordered chronologically, not when shuffled. Once outcome correlations are taken into account, the apparent shifts that seemed like mind–matter effects disappear. What remains is bias of human origin.
This conclusion does not impugn the sincerity of investigators; many worked in good faith. It reflects the evidence. The most coherent and economical explanation, consistent with all observations, is:
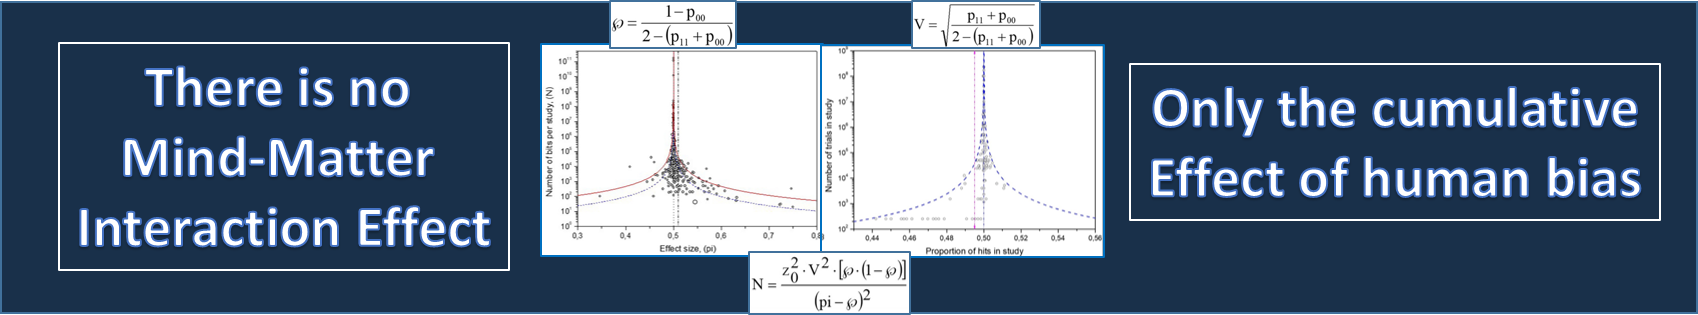
No consciousness-driven influence on physical systems—only the cumulative effects of human bias and error.
In line with parsimony, it is time to acknowledge this result and set the MicroPK hypothesis aside.
References
Bösch, H., Steinkamp, F., & Boller, E. (2006). Examining Psychokinesis: The Interaction of Human Intention with Random Number Generators—A Meta-Analysis. Psychological Bulletin, 132(4), 497–523.
Markov, A. A. (1913). An Example of Statistical Investigation of the Text “Eugene Onegin” Illustrating the Link of Trials in Chains. Izvestiya Akademii Nauk, Series VIII, Vol. VII. [English translation in Science in Context, 19(4), 591–600 (2006).]
Pallikari, F. (2015). Investigating the Nature of Intangible Brain-Machine Interaction. arXiv:1507.02219.
Pallikari, F. (2019). Investigating the nature of intangible brain–machine interactions. Journal of Social Sciences and Humanities, 1(5), 499–508. Also available at Zenodo: https://doi.org/10.5281/zenodo.16601748
Pallikari, F., & Papasimakis, N. (2008). Markovian Memory Embedded in Two-State Natural Processes. arXiv:0801.3053.
Radin, D., Nelson, R., Dobyns, Y., & Houtkooper, J. (2006). Reexamining psychokinesis: Comment on Bösch, Steinkamp, and Boller (2006). Psychological Bulletin, 132(4), 529–532.
von Mises, R. (1964). Mathematical Theory of Probability and Statistics. Academic Press (New York).
What Comes Next
In the next post, On the Question of Wavefunction Collapse in a Double-Slit Experiment, I examine a single laboratory study in detail to test whether its reported evidence for mind–matter interaction holds up under close scrutiny.